by Zannie Voss
Director, National Center for Arts Research
This post is part of a series in conjunction with TRG Arts on developing relationships with both new communities and existing stakeholders through artistic programming, marketing and fundraising, community engagement and public policy. (Cross-post can be found at Analysis from TRG Arts.)
In the National Center for Arts Research’s Edition 3 report on the health of the U.S. arts and cultural sector, we include insights on trends as well as updates on seven performance indices key to assessing organizational health, all related to earned revenue, marketing and participation. If we look across two of these indices — Response to Marketing and People per Offering – together they tell a story about supply, demand, and the tension between marketing and engagement.
Response to Marketing
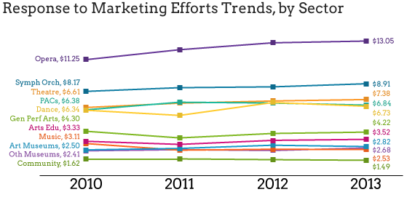
 Overall, marketing expenses per attendee trended upward over time but the rate of increase fell just shy of the rate of inflation. This means that the average organization spent nearly the same on marketing to attract each attendee in 2013 as in 2010 in inflation-adjusted figures. A closer examination, however, reveals different realities for different arts and cultural sectors.
Very different stories emerge from Response to Marketing trends for each of the 11 arts and cultural sectors we studied. It took fewer marketing dollars to bring in each attendee over time in the Arts Education, General Performing Arts (i.e., multidisciplinary performance series), Music, and Community sectors. Of these, all but the General Performing Arts sector saw annual attendance increase over time. When it costs less to bring in each person and more people attend, it’s demonstrates effective marketing and robust demand.
By contrast, the Art Museum, Opera, Performing Arts Center (PAC), Orchestra, Theatre, and Other Museum (e.g., Natural History and Science Museums) sectors experienced true growth in this index – growth that surpassed inflation. In other words, the average organization in these sectors had to spend more in marketing over time to attract every person who attended, and, of these sectors, all but Art Museums saw fewer people attend over time. When it costs more to bring in each person and fewer people attend, it is likely that there is either a marketing problem, a demand problem, or both.
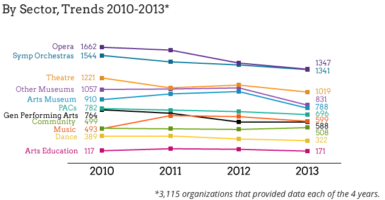
Only the Art Museum, Dance, Community, and Music sectors saw growth in annual attendance; all others saw attendance declines to varying degrees.
People Per Offering
 Lower attendance could be the result of fewer programmatic offerings – i.e., less supply. However, this was not generally the case. Arts Education was the only sector to average a reduction in the number of programs offered. All other sectors adopted a program proliferation strategy to varying degrees.
As a result, the overall number of people engaged per offering diminished slightly from 2010 to 2012 then declined dramatically in 2013. The 10.8% drop in this index over time is due to increases in programmatic offerings that outpaced growth in the number of people participating per offering. As we see in the details of trends by sector, size, and geography, the mushrooming of programmatic offerings is not driven by an outlier.
The Music and Community sectors – which spent fewer marketing dollars over time for every person who attended — added programmatic offerings and had growth in touch points that exceeded the growth in the number of offerings. As a result, the number of people engaged per offering grew over time. For all other sectors, People per Offering declined.
For six of the 11 sectors, the average organization touched fewer people over time while continuing to add programmatic offerings. There are numerous reasons why the mismatch of supply and demand might have occurred. It may be that new programmatic initiatives are taken on for mission-fulfillment purposes, not because they are expected to draw in large numbers of people. Or, it may be that funders encourage new program development without recognizing an organization’s need to concentrate on attracting more participants to existing offerings. Another hypothesis is that the divergent trends may be indicative of gaps in communication and strategy between departments responsible for programming and those responsible for connecting the organization to its community. Lastly, organizations experiencing a decline in touch points may see the need to bring in new, diverse participants and add new program offerings intended to attract them. Audience development is a long-term investment that requires dedicated marketing resources and may show little in the way of short-term returns.
Take Aways
A recent May 11 TRG Arts blog post by Chad Bauman, Managing Director, Milwaukee Repertory Theater, offered keen insights on whether and when to focus resources on developing new audiences or on increasing loyalty to bolster return on investment and per capita revenue. Our findings underscore the extent of the tradeoffs involved.
Supply or demand? Whether through desire, pressure, or necessity, the average organization in 10 of 11 arts and cultural sectors added programs over time. Bauman points out that nothing is sexier to most artistic directors and trustees than developing new audiences. Our data would indicate that developing new programs is right up there with it, perhaps as a means of developing new audiences, or perhaps in pursuit of mission or in response to a creative impulse or funding initiative. In six of the 11 sectors, the problem wasn’t sluggish attendance growth relative to growth in the number of programs, it was that the average organization actually touched fewer people over time with its programming as a whole while continuing to add new programs. Whatever the reason behind the program proliferation, at a minimum organizations should discuss across departments whether there is a mismatch in their supply and demand trends and determine the best path forward based on data, and the alignment of goals and available resources.
Demand or marketing? Organizations in numerous sectors spent more marketing dollars to bring in each attendee while the number of people engaged per offering declined. The marketing dollars requirement depends, of course, on which attendees are targeted. As Bauman points out, it costs more to bring in new audiences than it does to deepen loyalty with existing audiences, so higher marketing expenses per attendee may be a telltale sign that an organization is developing new audiences. In this case, the higher marketing spend is substantiated with a strategic rationale. Or, higher marketing expenses per attendee may also be driven by lackluster demand for the organization’s programmatic offerings. We’ve all been in meetings where marketing is blamed for poor attendance at a concert or production that falls flat. Another underlying cause of high marketing dollars spent per attendee centers on how marketing dollars are spent. It may well be that an organization’s marketing spend is in line with that of its peers, but it isn’t getting the same bang for the buck. It may be investing in marketing channels that are not a fit with its target audience or missing opportunities to better target campaigns.
Where does your organization stand on People per Offering and Response to Marketing relative to organizations like yours nationally? Later this summer NCAR will launch a free, online dashboard that provides organizations their scores on these and other performance indices, taking into account who you are and where you operate. These performance indices are internal conversation-starters. If you’re organization’s performance is where you’d like it be, that’s something to celebrate. If not, then is there a solid reason why, and what strategies and course corrections can guide you to your goals? There is not a one-size-fits-all ideal. It is up to every organization to decide where it wants to be, and whether its current number of offerings, levels of attendance and engagement, and marketing spend are aligned to achieve those goals.
About NCAR
Launched in 2012, the vision of the National Center for Arts Research (NCAR) at Southern Methodist University (SMU) is to act as a catalyst for the transformation and sustainability of the national arts and cultural community. The mission is to be the leading provider of evidence-based insights that enable arts and cultural leaders to overcome challenges and increase impact.
NCAR’s Director is Dr. Zannie Voss, also chair and professor of arts management and arts entrepreneurship in the Meadows School of the Arts and Cox School of Business, and Dr. Glenn Voss, endowed professor of marketing at Cox School of Business, serves as Research Director. Through this leadership, NCAR sources its cross-disciplinary academic expertise in the fields of arts management, marketing and statistics from Meadows and Cox faculty.
In 2012, the Meadows School of the Arts and Cox School of Business at SMU launched NCAR. The Center, the first of its kind in the nation, analyzes the largest database of arts research ever assembled; investigates important issues in arts management and patronage; and makes its findings available to arts leaders, funders, policymakers, researchers and the general public. With data from the DataArts Cultural Data Profile and other national and government sources such as the Theatre Communications Group, the League of American Orchestras, the National Endowment for the Arts, the Census Bureau, and the National Center for Charitable Statistics, the National Center for Arts Research is creating the most complete picture of the health of the arts sector in the U.S.

The “response to marketing” info also begins to reflect the stratospheric rise in importance of digital marketing. Marketing dollars must be spent across more platforms than even six years ago in 2010. Facebook’s algorithm has dropped organic reach to around 2% and Twitter’s feed changes are taking the followers we won and selling them back to us. Meanwhile, we can’t stop spending on older forms of marketing such as print, mail, and radio, or we lose older audience segments. As audiences continue to fragment across media platforms, it takes more money to reach the same number of people.
There’s an essential variable missing in all this – the content of the marketing. The language required to convince my grandmother to attend a concert forty years ago is very different from the language required to convince my grandniece today, but most arts organizations haven’t changed their messaging.
Look at any classical music marketing today and it’s content will be identical to content used by the same organization in 1976. The strategic assumptions that underlie messaging haven’t changed in forty years even though today’s audiences bear no resemblance to their predecessors. My grandmother died forty years ago but her local orchestra (Pittsburgh) is still talking to her, even though their language is less meaningful to each succeeding generation.
From a research perspective, this can be very useful. If the message content hasn’t changed, the relative measures of marketing’s effects over time are fairly reliable.
But if the content of arts marketing was designed for 1976 audiences, there’s no reasonable conclusion that can be drawn about demand. Marketing can’t leverage demand if its content isn’t designed in response to what 2016 audiences say they want.
Is demand diminishing? Is marketing tapping demand? The only way to know is to learn what new audiences want and then develop content accordingly. The unrelenting sameness of arts marketing content over four decades would suggest that this isn’t happening.