As a child, one of my favorite picture books* told the story of six field mice that visit a barn. At the end of the day, they are completely unable to reconcile what they have observed (a cow) because each has seen it from a different perspective – left side, front, bottom, right side, back & top.
The story comes to mind as I’ve downloaded the just-published National Endowment for the Arts’ 2012 Survey of Public Participation in the Arts – a report that deserves to be REQUIRED READING for leadership staff & Board members of all arts & cultural organizations.
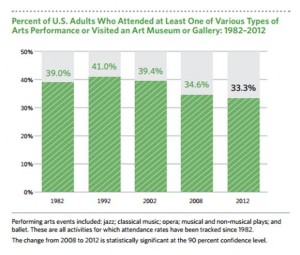
Excitedly, I jumped to a statistic I have been following closely for as long as I’ve been working in the field. It shows the “Percent of U.S. Adults who attended at least one of various types of arts performances or visited an art museum or gallery 1982 – 2012.”

It is disappointing – but not at all surprising – to see that the benchmark has dropped to 33.3 percent.
The chart suggests an obvious headline: ARTS PARTICIPATION CONTINUES TO ERODE.
Let’s think about that headline…
To “erode” – as if these remaining pillars of participation were like the formations of Monument Valley – last vestiges of ancient strength and vitality – with no remaining destiny other than to gradually wear away. Erosion is, by definition, inevitable and irreversible.
As a metaphor, “erosion” has its uses… Feel free to take your pick from among its many causes: declining arts education in schools; the Great Recession; the aging of arts audiences; competition with entertainment technology; the narrowing of community mindedness & and plenty more!
 The trouble with metaphors is that once accepted, they constrain our expectations of what is possible.
I don’t have one to offer right off the top of my head, but this certainly deserves come creative thought.
It appears that NEA recognizes this challenge, too. I’m delighted to see that they are inviting artists & designers to help develop new “visualizations” for this important data. Great Idea! This is a VITALLY IMPORTANT exercise to unlock new understandings of what this data should tell us about the opportunities ahead.
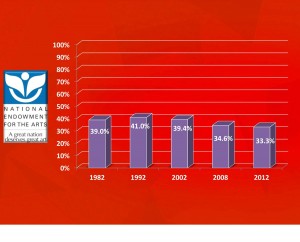
I’m no designer, but I can’t resist contributing one quick observation: The standard NEA chart (above) presents a “close up” of the data that reveals the downward trend. My graphics aren’t as sophisticated – but look what happens when you chart them against the total of 100% POSSIBLE participation:

Viewed from this perspective, it seems clear that the main story is not the “erosion” of arts participation so much as it is the overwhelming evidence that THE VAST MAJORITY OF US ADULTS DON’T PARTICIPATE IN THE ARTS – AND THEIR NUMBER IS GROWING!
The arrival of this new data deserves to be received as more than just an added chapter to a well-known story on a downward trajectory.
Now is the time to re-consider what the data is telling us and use it to create a dramatically different story – an uplifting and visionary story that revels in the idea that it is both DESIRABLE and POSSIBLE to assert the significance of arts participation in American society.
—–
*I’ve been searching for this book for years. Sadly, I don’t even recall its title. If anyone remembers anything this book, please know I’d be very grateful to hear from you!
