A few years ago, when the National Endowment for the Arts said it would join with the U.S. Bureau of Economic Analysis to determine how much the arts contributed to the economy, I applauded. When the very first data was released, I even tried to sell an article to about the beginning of this worthwhile effort. The editor I pitched passed, saying that we should wait until the data was more meaningful and more revealing.
How right he was. I still welcome the NEA’s initiative, but the release of a report today shows that this task will be harder than we perhaps thought. What we have now is not, to my eyes, very revealing about museums, operas, jazz venues, etc. The data are too encompassing.
Look at the headline numbers, quoted from the NEA release:
In 2013, arts and cultural production contributed $704.2 billion to the U.S. economy, a 32.5 percent increase since 1998, and 4.23 percent of total GDP…. more than some other sectors, such as construction ($619B) and utilities ($270B).
The annual growth rate for arts and culture as a whole (1.8 percent) was on par with that of the total U.S. economy (1.9 percent). But it grew faster than other sectors such as accommodation and food services (1.4 percent), retail trade (1.3 percent), and transportation and warehousing (1.1 percent).
Another key finding is that consumer spending on the performing arts grew 10 percent annually over the 15-year period.
The production of performing arts services has grown at a faster clip than arts and cultural production in general, contributing $44.5 billion to the U.S. economy in 2013.
In 2013, arts and cultural sector employed 4.7 million wage and salary workers, earning $339 billion. Industries employing the largest number of ACPSA workers include government (including school-based arts education), retail trade, broadcasting, motion picture industries, and publishing.
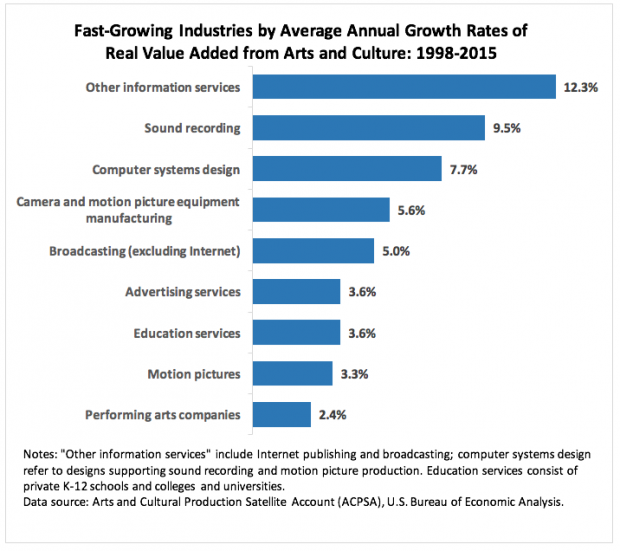
The industry with the fastest growth in arts and culture production between 1998 and 2013 was “other information services,†a category that includes online publishing, broadcasting, and streaming services (12.3 percent). Other fast-growing industries were sound recording (9.5 percent), arts-related computer systems design (including services for films and sound recordings) (7.7 percent), and regular broadcasting (5 percent).
You can see already one of the key problems. The numbers do not separate profit-making arts businesses from non-profit cultural institutions. Therefore, in that wonderful $44.5 billion contributed to the economy by performing arts services, what is (non-profit) opera? What is jazz? Are they shrinking while performances of “Tony and Tina’s Wedding” and “Menopause; The Musical” toured to more cities?
That consumer spending number also asks more questions than it answers: does it mean that more people went to performing arts productions, that prices were raised faster than other consumer spending, or both? Or something different?
Also, what would happen to these aggregate numbers if you subtract the motion picture business, television, “craft arts” (meaning production of jewelry, china, silverware and custom architectural woodwork), fashion, manufacture of musical instruments, etc.? Â They are all part of these accounts. The definitions are overly broad. (Witness this chart.)
The employment numbers include tattoo artists, TV broadcasters, newspaper photographers, business agents and camera repairmen as well as fine artists of all disciplines, btw.
I won’t go on. I’m glad the NEA/BEA are trying this, but for now it’s not much use to what RCA readers would consider the arts unless it continues to be refined. And I would ward off any use of the cultural sector being bigger than the construction sector without a definition in terms–to cite one example. The cultural sector, after all, gains nothing if its facts are not credible.
Chart Courtesy of the NEA

